Forecasts, Methods and Data
Review the held-out forecast queue, inspect the observations behind Revir's dated citations and compare all 18 benchmark arms.
2024 Forecast Replay
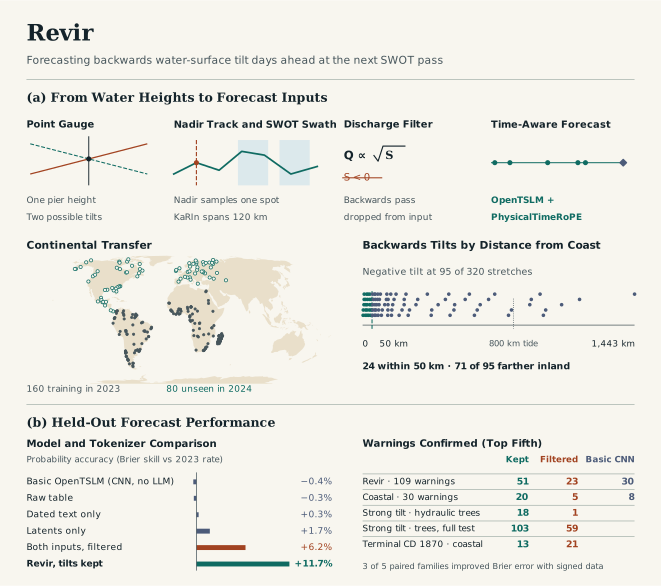
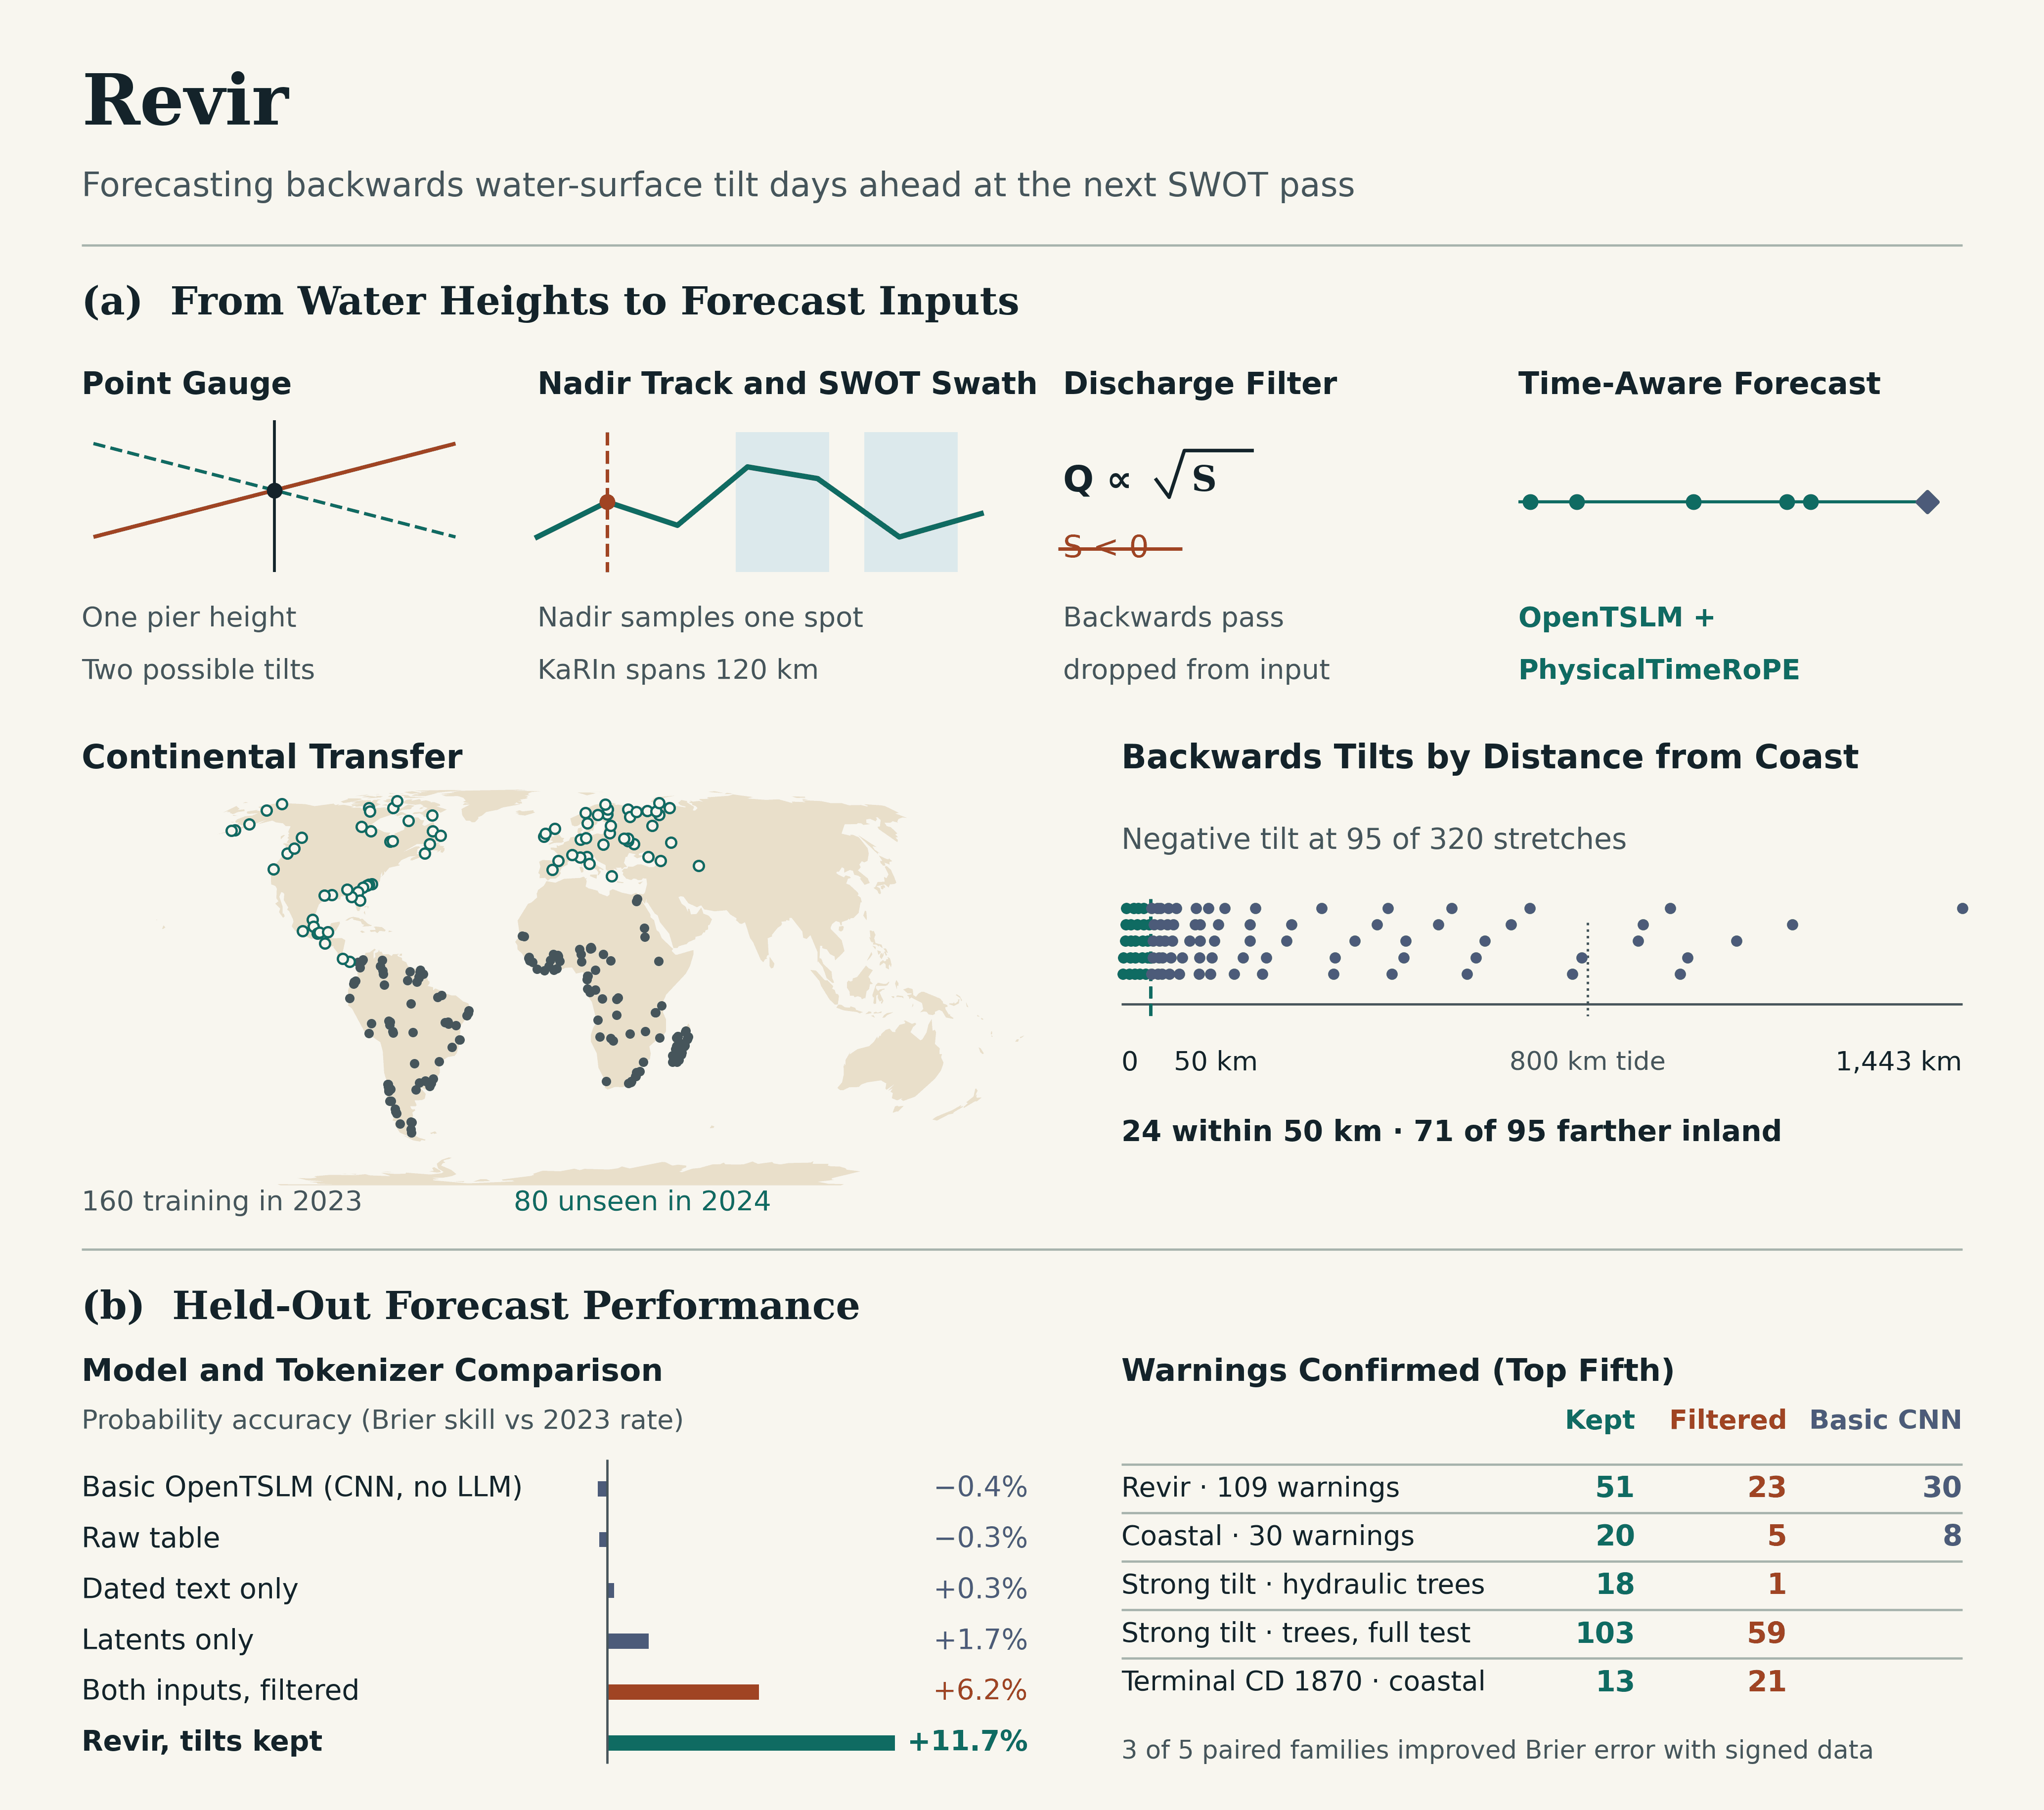
In the recent-backwater cohort, 51 of the first 109 forecasts in the kept queue preceded a measured inland tilt, compared with 23 in the matched filtered queue. Some forecasts share a verifying pass. The readout counts both forecast hits and distinct passes.
Forecast Queue
The result describes the measured pass. Only inland tilts beyond 1σ count as hits for the strong-tilt target.
| Cohort | Reviews | Matched model | Kept hits | Deleted hits |
|---|---|---|---|---|
| Recent backwater | 109 | Grounded Qwen2.5-7B | 51 | 23 |
| Recent coastal | 30 | Grounded Qwen2.5-7B | 20 | 5 |
| Recent backwater | 109 | Hydraulic trees · strong tilt | 18 | 1 |
| All unseen reaches | 1691 | Hydraulic trees · strong tilt | 103 | 59 |
The interactive queue uses the same held-out forecasts as this table.
Dated Observations and Prompt Audit
Forecast row 7170, unnamed European reach 24294000061, issued 3 May 2024. The archived explanation cites the 24 April 2024 and 14 April 2024 readings.
| Date | m per 10 km |
|---|---|
| 24 April 2024 | 7.360 |
| 14 April 2024 | 6.327 |
Reveal verifying pass
5 May 2024 · 6.843 m downstream fall per 10 km.
The frozen grounded audit reproduced 98/98 expected date-and-value fields for the latest and recent minimum observations, versus 0/98 for the latent-only version. Given both dates in its two-line prompt anchor, the grounded model reproduced 149/188 wider expected facts and made 31/180 unsupported numeric mentions.
Benchmarks and Scope
Brier error scores the probability forecast. Queue hits count how many reviewed forecasts preceded a measured event. The two measures can favour different models.
Full 18-arm benchmark and scope limits
Recent-backwater confirmation in 2024, with 545 orbital forecasts at 26 reaches. Each issue counts once. Ties are ordered by frozen membership row. Random expectation is an additional comparison.
| Arm | Brier | Brier skill | AUROC | Hits | Distinct passes | Cut-off tie range |
|---|---|---|---|---|---|---|
| Both inputs, tilts kept | 0.20173 | +11.7% | 0.648 | 51 | 19 | 50–62 |
| Both inputs, tilts deleted | 0.21437 | +6.2% | 0.577 | 23 | 11 | 20–25 |
| Dated text summary only | 0.22787 | +0.3% | 0.436 | 19 | 11 | 13–29 |
| Time-series latents only | 0.22465 | +1.7% | 0.674 | 44 | 18 | 34–47 |
| Off-the-shelf LLM (raw table) | 0.22926 | −0.3% | 0.521 | 29 | 18 | 28–29 |
| Encoder + Perceiver, no LLM | 0.20030 | +12.3% | 0.637 | 41 | 16 | 40–41 |
| Hydraulic trees · kept | 0.18832 | +17.6% | 0.592 | 35 | 12 | 35–35 |
| Hydraulic trees · deleted | 0.19889 | +13.0% | 0.601 | 39 | 12 | 39–39 |
| Persistence · kept | 0.29632 | −29.7% | 0.451 | 14 | 10 | 14–14 |
| Persistence · deleted | 0.19406 | +15.1% | 0.655 | 54 | 16 | 50–54 |
| Basic OpenTSLM tokenizer (CNN, no LLM) | 0.22941 | −0.4% | 0.603 | 30 | 12 | 29–31 |
| PhysicalTimeRoPE | 0.23029 | −0.8% | 0.674 | 49 | 15 | 43–60 |
| RankRoPE | 0.22135 | +3.1% | 0.627 | 41 | 17 | 41–42 |
| CD Terminal 1870 · kept | 0.19698 | +13.8% | 0.636 | 45 | 18 | 45–45 |
| CD Terminal 1870 · deleted | 0.18412 | +19.4% | 0.668 | 60 | 18 | 60–60 |
| CD Candidate 80 · 1h interim | 0.18427 | +19.4% | 0.656 | 47 | 15 | 47–47 |
| Four-visit noise · kept | 0.17973 | +21.3% | 0.617 | 27 | 14 | 27–27 |
| Four-visit noise · deleted | 0.18686 | +18.2% | 0.655 | 49 | 14 | 49–49 |
| Random review, expectation | · | · | 0.500 | 26.00 | 19.67 | · |
| Arm | Brier | Brier skill | AUROC | Hits | Distinct passes | Cut-off tie range |
|---|---|---|---|---|---|---|
| Both inputs, tilts kept | 0.10077 † | +0.1% | 0.300 | 1 | 1 | 0–1 |
| Both inputs, tilts deleted | 0.10037 † | +0.5% | 0.339 | 4 | 2 | 4–4 |
| Dated text summary only | 0.09815 † | +2.7% | 0.564 | 15 | 10 | 9–20 |
| Time-series latents only | 0.09808 † | +2.7% | 0.415 | 2 | 2 | 0–3 |
| Off-the-shelf LLM (raw table) | 0.09899 † | +1.8% | 0.485 | 11 | 5 | 10–11 |
| Encoder + Perceiver, no LLM | 0.10616 † | −5.3% | 0.354 | 2 | 2 | 2–2 |
| Hydraulic trees · kept | 0.09456 | +6.2% | 0.603 | 18 | 7 | 18–18 |
| Hydraulic trees · deleted | 0.10102 | −0.2% | 0.289 | 1 | 1 | 1–1 |
| Persistence · kept | 0.11446 | −13.5% | 0.417 | 14 | 10 | 14–14 |
| Persistence · deleted | 0.10152 | −0.7% | 0.341 | 5 | 3 | 5–5 |
| Basic OpenTSLM tokenizer (CNN, no LLM) | 0.10137 | −0.5% | 0.386 | 10 | 5 | 10–10 |
| PhysicalTimeRoPE | 0.10110 | −0.3% | 0.352 | 3 | 2 | 0–6 |
| RankRoPE | 0.09901 | +1.8% | 0.347 | 4 | 4 | 2–6 |
| CD Terminal 1870 · kept | 0.11217 † | −11.2% | 0.316 | 2 | 2 | 2–2 |
| CD Terminal 1870 · deleted | 0.11579 † | −14.8% | 0.298 | 3 | 2 | 3–3 |
| CD Candidate 80 · 1h interim | 0.11506 † | −14.1% | 0.329 | 6 | 4 | 6–6 |
| Four-visit noise · kept | 0.10235 † | −1.5% | 0.539 | 19 | 10 | 19–19 |
| Four-visit noise · deleted | 0.10991 † | −9.0% | 0.316 | 1 | 1 | 1–1 |
| Random review, expectation | · | · | 0.500 | 11.20 | 9.09 | · |
† Any-tilt model ranking evaluated against the outcome beyond 1σ. Probability error is a cross-target diagnostic.
Keeping inland tilts lowers Brier error in 3 of the 5 paired model families. The kept grounded model scored +11.7% Brier skill. Arms with higher skill on this cohort were Encoder + Perceiver, no LLM, Hydraulic trees · kept, Hydraulic trees · deleted, Persistence · deleted, CD Terminal 1870 · kept, CD Terminal 1870 · deleted, CD Candidate 80 · 1h interim, Four-visit noise · kept and Four-visit noise · deleted.
At 109 reviews, filtered persistence found 54 hits on 16 distinct passes. The kept grounded model found 51 on 19 distinct passes, 33 coastal and 18 inland. The signed four-visit noise model had a Brier error of 0.17973.
The recent-backwater cohort had 56 strong-tilt forecast issues across 23 distinct passes. The matched trees found 18 vs 1 hits at 109 reviews. In the top fifth (1,691 reviews) across all 80 reaches, the trees found 103 vs 59.
The replay ranks archived forecasts across a fixed set of issues. Forecasts share verifying passes, and measured tilts smaller than the reported uncertainty count for the any-tilt endpoint. Test membership is disjoint from project training by reach, level-six SWORD basin and network group. Foundation-model pretraining is outside this audit. Operational lead time, salinity at intakes, drainage decisions and flood losses require separate observations and prospective evaluation.
Forecast Method and Ablations
We keep the sign of quality-screened SWOT slopes acquired before issue, as reprocessed in Version D. Across irregular satellite intervals, the model encodes elapsed time, orbit and tide information and receives a short dated summary.
PhysicalTimeRoPE encodes the target stretch's signed tilt, water-height anomaly and measurement uncertainty with 32 rotary periods. The OpenTSLM masked Perceiver supplies 64 latent prefix tokens. A two-line dated summary provides the latest observation, the four-visit nonnegative baseline, the recent minimum and the lunar phase contrast when available. Qwen2.5-7B uses LoRA adaptation. The replay uses the calibrated probability from its Yes/No token scores.
Matched Input Ablations
Matched Qwen2.5-7B Brier skill against the 2023 event rate, on 545 forecast issues at 26 recent-backwater reaches in 2024.
| Off-the-shelf LLM (raw table) | −0.3% |
|---|---|
| Dated text summary only | +0.3% |
| Time-series latents only | +1.7% |
| Both inputs, tilts deleted | +6.2% |
| Both inputs, tilts kept | +11.7% |
Paired reach-bootstrap intervals for the kept model's gains over filtered, text-only and latent-only inputs excluded zero. The kept–filtered difference is +5.53 percentage points (+0.53 to +7.67).
Elapsed Time and Coastal Terms
The basic OpenTSLM arm uses the upstream CNNTokenizer in a standalone CNN encoder and forecast head with 1.10M trainable parameters, scored on the same held-out forecast issues using signed SWOT visits.
On recent-backwater stretches, that CNN arm scored −0.4% Brier skill (0.603 AUROC), catching 30 hits in 109 reviews and 8 versus 20 for the full model in 30 coastal reviews (2.5 times as many coastal hits). PhysicalTimeRoPE also lowered synthetic irregular-pulse Brier error by 12.7% compared with the CNN.
In the separate clock diagnostic, the PhysicalTimeRoPE encoder ranked inland tilts at AUROC 0.674 versus 0.627 for RankRoPE at recent-backwater reaches, though its Brier error was higher in that cohort (13.7% lower error than RankRoPE on synthetic pulses).
On 6 recent coastal reaches, symbolic equation search (terminal CD Candidate 1870) found 13 hits with tilts kept and 21 with tilts deleted in 30 forecast reviews. Brier errors were 0.24181 and 0.20120, respectively. One reach accounted for 41 of the 50 positive forecast issues.
Calibrated with equal issue weights, the signed four-visit uncertainty baseline found 10 hits, whereas disclosed 1-hour Candidate 80 found 24 with 17.7% lower coastal Brier error. That Brier advantage disappeared after the 24-hour 2023 search. Terminal selection lowered Brier error on T2 steepening with tilts kept (0.15840 versus 0.16203 across 80 reaches).
Discarded Passes and Lunar Timing
The discharge rule would remove 586 of 20,083 quality-screened SWOT passes at 95 of 320 stretches. This includes 211 passes more than 1.96 reported measurement uncertainties below zero.
| Reach Group | Stretches | Mean R | Nominal p | Holm p |
|---|---|---|---|---|
| Coastal | 13 | 0.367 | 0.005 | 0.060 |
| Flat inland | 28 | 0.303 | 0.495 | · |
The permutation draws event times from the actual passes at each stretch and averages the phase-vector lengths with equal reach weights. The coastal adjustment covers 12 tests. The pooled inland result leaves the cause of individual passes open.
All 95 Reaches With Discarded Passes
| Reach | Screened | Deleted | Beyond 1.96σ | Share |
|---|---|---|---|---|
| Eider | 152 | 52 | 0 | 34.2% |
| Unnamed Bahia coast reach, Brazil | 128 | 36 | 10 | 28.1% |
| 24480900071 | 152 | 25 | 16 | 16.4% |
| Unnamed Gulf coast reach, Mexico | 43 | 25 | 0 | 58.1% |
| Tombigbee River floodplain, US | 43 | 23 | 0 | 53.5% |
| Yata River | 88 | 21 | 2 | 23.9% |
| Trent, UK | 83 | 18 | 6 | 21.7% |
| Weser River, Germany | 88 | 15 | 15 | 17.0% |
| 85104000031 | 107 | 14 | 12 | 13.1% |
| 14631000141 | 40 | 12 | 0 | 30.0% |
| Kuban | 41 | 12 | 7 | 29.3% |
| 26170400161 | 132 | 10 | 9 | 7.6% |
| Nile River | 129 | 9 | 0 | 7.0% |
| Tanaro River, Italy | 46 | 9 | 8 | 19.6% |
| 24440500271 | 56 | 9 | 2 | 16.1% |
| Rio Negro, Brazil | 130 | 9 | 5 | 6.9% |
| Unnamed James Bay coast reach, Canada | 54 | 9 | 2 | 16.7% |
| 81156000011 | 28 | 9 | 0 | 32.1% |
| 83192000271 | 75 | 9 | 7 | 12.0% |
| Tano River, Ghana | 92 | 8 | 8 | 8.7% |
| 14633000341 | 38 | 8 | 3 | 21.1% |
| Psel | 54 | 8 | 6 | 14.8% |
| 26190100141 | 52 | 8 | 0 | 15.4% |
| Selawik River, Arctic Alaska | 186 | 8 | 2 | 4.3% |
| Tevere | 30 | 7 | 5 | 23.3% |
| Courantyne | 46 | 7 | 0 | 15.2% |
| Malani | 123 | 7 | 5 | 5.7% |
| La Mana, French Guiana | 115 | 7 | 1 | 6.1% |
| 62269300551 | 32 | 7 | 1 | 21.9% |
| 64140400031 | 47 | 7 | 0 | 14.9% |
| Pantanal Basin, South America | 134 | 7 | 5 | 5.2% |
| Noatak River | 110 | 7 | 6 | 6.4% |
| Wolf River | 74 | 6 | 0 | 8.1% |
| 73255000131 | 34 | 6 | 2 | 17.6% |
| 24328900031 | 33 | 5 | 5 | 15.2% |
| Oulujoki | 73 | 5 | 0 | 6.8% |
| 26190400251 | 80 | 5 | 4 | 6.3% |
| 28160700021 | 58 | 5 | 0 | 8.6% |
| Beni River | 100 | 5 | 2 | 5.0% |
| Savannah River | 26 | 5 | 0 | 19.2% |
| 75350400081 | 26 | 5 | 0 | 19.2% |
| Meade River | 65 | 5 | 3 | 7.7% |
| 14443000121 | 26 | 4 | 1 | 15.4% |
| Mauwa | 29 | 4 | 4 | 13.8% |
| 25210800031 | 213 | 4 | 2 | 1.9% |
| Orinoco | 123 | 4 | 4 | 3.3% |
| 71230300041 | 69 | 4 | 0 | 5.8% |
| Alabama River | 28 | 4 | 1 | 14.3% |
| 75377000171 | 28 | 4 | 4 | 14.3% |
| 81360000091 | 111 | 4 | 2 | 3.6% |
| Mouhoun River | 31 | 3 | 2 | 9.7% |
| Bamingui River | 41 | 3 | 3 | 7.3% |
| Itomampy | 38 | 3 | 0 | 7.9% |
| Khopyor River | 59 | 3 | 1 | 5.1% |
| Gauja | 54 | 3 | 2 | 5.6% |
| 26184000431 | 97 | 3 | 2 | 3.1% |
| 28324100211 | 31 | 3 | 3 | 9.7% |
| Uruguay River | 41 | 3 | 0 | 7.3% |
| Rio Cayapas | 30 | 3 | 0 | 10.0% |
| Caloosahatchee River | 19 | 3 | 0 | 15.8% |
| 75371200171 | 25 | 3 | 1 | 12.0% |
| Kafue River | 39 | 2 | 0 | 5.1% |
| Nyong River | 47 | 2 | 1 | 4.3% |
| Ikopa | 42 | 2 | 0 | 4.8% |
| 25254000321 | 73 | 2 | 2 | 2.7% |
| 28100100271 | 41 | 2 | 0 | 4.9% |
| Malani | 128 | 2 | 1 | 1.6% |
| Isiboro River | 104 | 2 | 0 | 1.9% |
| 63103400231 | 43 | 2 | 0 | 4.7% |
| Riacho Monte Lindo Grande | 82 | 2 | 2 | 2.4% |
| 71120000251 | 41 | 2 | 0 | 4.9% |
| Savannah River | 29 | 2 | 2 | 6.9% |
| St. Johns River, US | 12 | 2 | 1 | 16.7% |
| 83170500931 | 83 | 2 | 2 | 2.4% |
| Ngounie River | 25 | 1 | 1 | 4.0% |
| 14221400031 | 135 | 1 | 0 | 0.7% |
| Daka | 41 | 1 | 1 | 2.4% |
| White Volta | 42 | 1 | 0 | 2.4% |
| 17211100441 | 111 | 1 | 0 | 0.9% |
| Manambavana | 23 | 1 | 0 | 4.3% |
| Tevere | 41 | 1 | 1 | 2.4% |
| Snov | 65 | 1 | 0 | 1.5% |
| 22560200101 | 88 | 1 | 0 | 1.1% |
| River Shannon | 86 | 1 | 0 | 1.2% |
| Nemunas River | 47 | 1 | 0 | 2.1% |
| 24294000061 | 55 | 1 | 0 | 1.8% |
| Lakselva | 123 | 1 | 1 | 0.8% |
| 25260400141 | 89 | 1 | 0 | 1.1% |
| 26148000301 | 79 | 1 | 1 | 1.3% |
| 27106000141 | 83 | 1 | 1 | 1.2% |
| Malani | 83 | 1 | 1 | 1.2% |
| L'Approuague | 37 | 1 | 0 | 2.7% |
| Yata River | 104 | 1 | 0 | 1.0% |
| 67205001081 | 36 | 1 | 1 | 2.8% |
| 72370000051 | 40 | 1 | 1 | 2.5% |
Gauge Appendix for the River Trent at Keadby
This 2024 development example is separate from the unseen forecast test. At Keadby, the pumping station drains at high tide into a 10.46 km tidal Trent stretch towards the Humber, where a gauge reports pier height while SWOT measures tilt along the reach. Keadby Pumping Station
| Date | SWOT measured | Gauge either side of pass |
|---|---|---|
| 12 March 2024 | 0.86 ± 0.20 m seaward rise per 10 km | 3.188 → 3.965 m |
| 17 March 2024 | 0.84 ± 0.21 m seaward fall per 10 km | 1.972 → 1.870 m |
A single pier height fits both an inland and a seaward tilt. The flow filter retained 65 of 83 quality-screened SWOT passes in 2023–24. Keeping both signs retained all 83.
On 12 March 2024, the Keadby gauge rose +0.78 m in 15 minutes around the pass. The Environment Agency marked the readings Unchecked. SWOT supplies a spatial gradient. Neither instrument measures salinity or flow speed directly.