Rivers can flow backwards.
Revir forecasts when.

Storm surges and low river flow let seawater intrude into municipal drinking-water intakes, raising sodium, corroding pipes and spoiling irrigated crops. Far inland, flooded main rivers back water up into tributaries, forcing floodgates shut and submerging farmland. Multi-day advance notice of upstream water-surface setups helps utilities switch intakes, engineers close floodgates or raise underwater sills, and farmers time irrigation draws.

The SWOTNASA and CNES Surface Water and Ocean Topography satellite (launched December 2022). Its 120 km KaRIn radar interferometer maps water-surface height and inclination across rivers wider than 100 m. satellite maps river-surface inclination across channels wider than 100 m, yet its 21-day orbit revisits any covered stretch on irregular intervals from under a day to 21 days. Revir combines those sparse, signed slope passes with tidal and orbital timing (OpenTSLM + PhysicalTimeRoPE) to forecast 2 to 21 days ahead whether SWOT will measure a backwards surface tilt on the next pass, matching 2.5 times as many coastal warnings as a basic time-series model (20 vs 8 of 30 archived warnings, across 8 vs 3 distinct passes).
Intake and floodgate (upstream) Surge / flooded mainstem SWOT swath elevations +Δh Upstream pressure force (−g ∂h/∂x) 10 km river stretch (vertical scale exaggerated) Irregular SWOT passes Revir forecast (2–21 d) short gap long gap (≤21 d) Issue Backwards tilt alert
When downstream water stands higher, the surface tilts backwards towards intakes and floodgates. Revir forecasts next-pass tilt probability days ahead.

Motivation

What Happens When Water Pushes Upstream

Storm surges, low discharge and flooded mainstems push seawater into coastal intakes and impound tributary floodwater hundreds of kilometres inland.

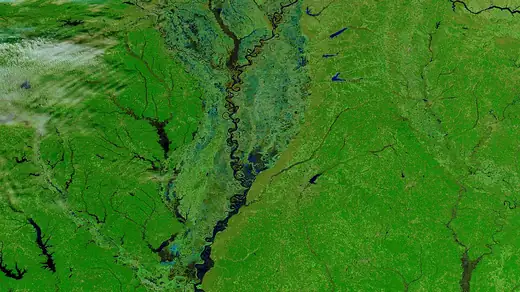
NASA MODIS false-colour satellite view of extensive backwater flooding across the Yazoo and Lower Mississippi floodplain
NASA MODIS Terra · Lower Mississippi and Yazoo floodplain

548,000 acres flooded · $42,160 mean household outlay

Mississippi and Yazoo Basin, US

High Mississippi stage in 2019 forced the Steele Bayou floodgates shut, inundating 231,000 acres of cropland ($800 million in reported farm losses, with $42,160 mean cash outlay per surveyed household). In 2022–23, a Gulf saltwater wedge prompted an underwater sill and emergency water barging for Plaquemines treatment plants.

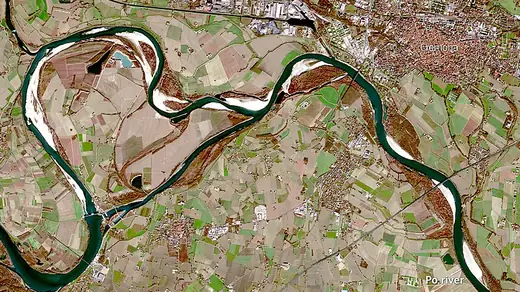
Copernicus Sentinel-2 satellite view of exposed white sandbars along the drought-depleted Po River in northern Italy
EU Copernicus Sentinel · Po River drought

40 km inland salt wedge · worst Po drought in 2 centuries

Po River Delta, Italy

During northern Italy's 2022 drought, the most severe Po low-flow episode in over 2 centuries, Adriatic seawater pushed roughly 40 km up the Po Delta branches, spoiling irrigation draws and prompting salt-barrier intervention at Po di Pila.

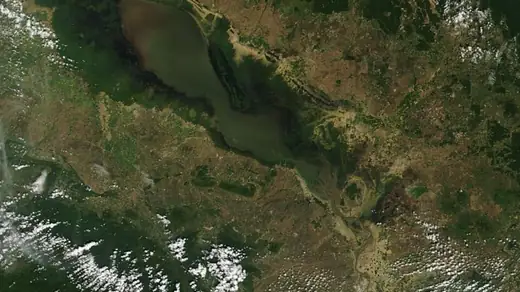
NASA MODIS satellite view of Tonlé Sap Lake and its reversible river connection to the Mekong
NASA MODIS Terra · Tonlé Sap and Mekong basin

13 Mekong Delta provinces · 150,000 km2 near estuaries worldwide

Mekong, Tonlé Sap and Bangkok

Monsoon floods reverse the Tonlé Sap River inland for months, while dry-season salt intrusion affects 13 Mekong Delta provinces and reaches Bangkok's municipal intakes on the Chao Phraya. Worldwide, 150,000 km2 of low-lying cropland sit within 10 km of estuaries.

Physical scope: SWOT measures 10 km water-surface tilt across channels wider than 100 m, which gives the barotropic surface-pressure force. Inertia, bed friction and estuarine density gradients also govern velocity, and a dense bottom salt wedge can intrude beneath downstream surface flow, so discharge and tap-water salinity require in-situ sensors. The 2019 Yazoo flood and 2022 Po drought predate SWOT's December 2022 launch.

The Measurement Gap

Why River Reversals Were Hard to Track

Point Gauges Measure One Height

Same stage at single pier Normal downhill Backwards tilt
Downhill and backwards tilts both pass through the same recorded pier stage.

86% of GRDC stations had no 2020 record

77% of public gauges lacked real-time telemetry

On Arctic Alaska's Selawik River, the nearest station in our gauge crosswalk lies 70.7 km away. GRDC Archive · Riggs et al.

SWOT Maps Slope, Infrequently

Nadir altimeter SWOT KaRIn swath 1 spot · 10–27 d 120 km · ≤21 d
Plan view. Twin 50 km KaRIn swaths span 120 km across a 20 km nadir gap.

Conventional nadir altimeters cross a river at a single spot every 10 to 27 days. SWOT maps elevation along the channel at each crossing to resolve tilt, yet leaves irregular gaps up to 21 days between passes at a stretch. KaRIn Radar · Repeat Orbits

Discharge Rules Drop Negative Slopes

Standard friction-slope discharge pipelines discard negative tilts across 586 passes at 95 of 320 stretches (211 passes beyond 1.96σ). The raw SWOT river archive retains those signed tilts. RiverObs Code

≤50 km: 24 coastal stretches 71 inland stretches (up to 1,443 km from mapped coast) 0 50 km 1,443 km
Backwards tilts extend far beyond coastal estuaries. Ocean tides can still modulate freshwater stage hundreds of kilometres upriver in low-gradient rivers, exceeding 600 km in large tidal rivers and 1,000 km along the Amazon (Hoitink and Jay · Kosuth et al.). Across SWOT's 95 stretches with backwards tilts, 24 lie within 50 km of the mapped coast and 71 (75%) lie farther inland, out to 1,443 km across floodplains, ice jams and regulated reaches.

Archived Forecast Replay

Forecasting Backwards Tilts Before the Next Pass

In an archived causal replay 2 to 21 days before SWOT returns, every method can flag its highest-risk 1 in 5 of unseen 2024 forecast issues. On coastal estuaries, 20 of 30 Revir warnings matched a measured backwards tilt across 8 distinct satellite passes, versus 8 of 30 for a basic OpenTSLM CNN.

Unnamed Gulf coast reach, Mexico (24 km from coast, ungauged)

Last pre-issue pass 10 May · Forecast issued 18 May 2024 · Verified 10.5 days later

0 Observed SWOT passes (true UTC dates) Predicted (2–21 d) 18.4 d Query +10.5 d Measured −0.114 backwards passes kept by Revir 26 Mar Issue 18 May +21 d

Signed water-surface tilt (metres per 10 km, ±1σ) · below 0 means downstream water stands higher (backwards tilt)

What SWOT measured when it returned

Next SWOT pass (28 May 2024, 12:13 UTC): downstream water stood higher by 0.11 ± 0.18 m per 10 km (within 1σ measurement uncertainty).

Archived Pre-Pass Forecast Rankings

In the archived replay, each method can flag its highest-risk 1 in 5 forecast issues (109 of 545).

  • Revir · OpenTSLM + PhysicalTimeRoPE (signed SWOT) Flagged
    13.83% Priority #50 of 545
  • Basic OpenTSLM Tokenizer · CNN (even steps, no LLM) Not flagged
    2.51% Priority #128 of 545
  • Same Foundation Model · Backwards Tilts Filtered Out Not flagged
    6.77% Priority #224 of 545
  • Off-the-Shelf Qwen2.5-7B on Raw Number Table Not flagged
    2.04% Priority #128 of 545

How Many Flagged Forecasts Matched a Backwards Tilt?

Each square is one top-fifth archived forecast flagged 2 to 21 days before SWOT's pass. Filled squares show forecasts where SWOT then measured a backwards surface tilt (paired with distinct satellite passes, as forecasts issued on different days can target the same pass).

Randomly flagging 30 archived forecasts would match 10 backwards tilts on average (dashed line).

Revir · OpenTSLM + PhysicalTimeRoPE 20 of 30 matched · 8 distinct passes
Basic OpenTSLM CNN (even steps, no LLM) 8 of 30 matched · 3 passes
Off-the-Shelf Qwen2.5-7B (raw numbers) 4 of 30 matched
Same Model · Backwards Tilts Filtered Out 5 of 30 matched · 4 passes

What the Ablations Show

Brier skill relative to the 2023 event rate across 545 unseen backwater forecast issues.

  • Revir (PhysicalTimeRoPE + dated text, tilts kept)+11.7%
  • Same model, backwards tilts filtered out+6.2%
  • Time-series latents only (no dated text)+1.7%
  • Dated text summary only (no time-series latents)+0.3%
  • Off-the-shelf Qwen2.5-7B on raw number table−0.3%
  • Basic OpenTSLM tokenizer (CNN, no LLM)−0.4%

On coastal estuaries, Revir reached +18.0% Brier skill, matching 20 of 30 flagged forecasts (2.5× the basic OpenTSLM CNN and 4× filtered data). For strong backwards tilts beyond 1σ, keeping signed training tilts raised matched hydraulic-tree detections from 1 to 18 of 109 top-fifth warnings (and from 59 to 103 of 1,691 across all 8,457 unseen forecasts), while reducing Brier error in 3 of 5 paired model families. Inspect all 18 benchmark arms

Architecture and Novel Tokenizer

Inside the Time-Aware Foundation Model

Select an unseen river and switch between continuous physical time and standard step indices to see how PhysicalTimeRoPE and OpenTSLM encode irregular pass spacing and dated hydraulic context into a next-pass probability.

Observed Inputs

Irregular Signed Passes and Predicted Next-Pass Window

Showing the 6 latest pre-issue visits (Revir encodes up to 16 target-stretch visits).

0 Observed SWOT passes (true UTC dates) Predicted (2–21 d) 18.4 d Query +10.5 d Measured −0.114 backwards passes kept by Revir 26 Mar Issue 18 May +21 d

Signed water-surface tilt (metres per 10 km, ±1σ) · below 0 means downstream water stands higher (backwards tilt)

  • Downhill tilt (seaward slope)
  • Backwards tilt (upstream pressure force)
Novel Tokenizer

PhysicalTimeRoPE Preserves Elapsed Days

Standard time-series tokenizers step by visit count (1, 2, 3), treating a sub-day revisit and a three-week gap as identical. PhysicalTimeRoPE rotates token feature pairs by exact elapsed time.

θk(Δt) = 2π Δt mod PkPk computed in float64 across 32 periods Pk
Basic OpenTSLM step index (1, 2, 3 …) PhysicalTimeRoPE elapsed days (float64 Δt) Shortest vs longest gap: 2.5 d (42° orbit) vs 18.4 d (318° orbit) PhysicalTimeRoPE preserves exact day spacing and orbital/tidal phase.

Phase on Pinned Physical Clocks (Selected Pass)

Click or hover any pass above to inspect its modular phase across tidal and orbital periods.

Lunar tide · 12.42 h
191°
Spring–neap · 14.77 d
110°
SWOT orbit · 20.86 d
0°

Orbit-predicted query pass: 28 May at 12:11 UTC (+10.5 days after issue).

PhysicalTimeRoPE cut synthetic irregular-pulse Brier error by 12.7% compared with OpenTSLM's CNNTokenizer. Tokenizer Ablations

Multimodal Grounding

OpenTSLM Perceiver Prefix + Dated Hydraulic Summary → Qwen2.5-7B

Continuous Time-Series Prefix

Masked Perceiver compresses up to 64 prefix tokens from the irregular visits and orbit query.

Dated Pre-Issue Hydraulic Anchor

Pre-issue fall (m/10 km): latest 2024-05-10, 0.021 ± 0.212. Four-visit nonnegative baseline 0.017.

Visible 21-day minimum 2024-05-07, −0.021 m/10 km. M2 cosine contrast (query minus latest) 0.558.

Reproduced 98/98 exact dated fields across 50 audited prompts (versus 0/98 with latents alone). Prompt Audit

LoRA-Adapted Qwen2.5-7B Output (Revir)

13.8% backwards-tilt probability · Priority #50 of 545 · Flagged in top-fifth replay allowance

Next SWOT pass (28 May 2024, 12:13 UTC): downstream water stood higher by 0.11 ± 0.18 m per 10 km (within 1σ measurement uncertainty).

Zero-Shot Basin Transfer

Unseen Test Basins Across New Continents

We trained on 160 stretches in Africa and South America (2023) and evaluated once on 80 unseen stretches in Europe, North America and the Arctic (2024), with 0 shared river basins and 44 of 80 test stretches (55%) unnamed in SWORD.

Click any marker on the map to inspect its SWOT pass record.

Solid marks show 2023 training stretches. Teal rings show unseen 2024 test stretches (diamonds mark inland stretches).

Or jump to a featured stretch

Tombigbee River floodplain, US

Unseen 2024 test stretch, 230 km inland. Standard filtering drops 23 of 43 passes.

0 Observed SWOT passes (true UTC dates) Predicted (2–21 d) 10.9 d Query +2.8 d Measured −0.025 backwards passes kept by Revir 18 Sept Issue 17 Nov +21 d

Signed water-surface tilt (metres per 10 km, ±1σ) · below 0 means downstream water stands higher (backwards tilt)

  • Downhill tilt (seaward slope)
  • Backwards tilt (upstream pressure force)

Inspect the full 95-stretch deletion ledger and lunar timing test